Python - GUI - Tkinter(Bar & Pie Chart)

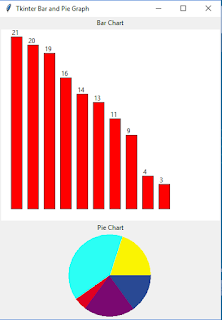
Quickly, i just want to show you a simple example of creating bar and pie chart with Tkinter . Try this simple example: import tkinter as tk root = tk.Tk() root.title("Tkinter Bar and Pie Graph") #here is for bar chart............ tk.Label(root, text='Bar Chart').pack() data = [21, 20, 19, 16, 14, 13, 11, 9, 4, 3] c_width = 400 c_height = 350 c = tk.Canvas(root, width=c_width, height=c_height, bg= 'white') c.pack() #experiment with the variables below size to fit your needs y_stretch = 15 y_gap = 20 x_stretch = 10 x_width = 20 ...
